China Best Solar Installation What Mistakes to Avoid?

Time:2026-10-11 Author:Aria
0%

Choosing the best solar installation in China involves more than comparing panel prices. Homeowners must examine design quality, installer experience, wiring standards, roof conditions, and after-sales support. A polished quotation can still hide weak components or unclear responsibilities.

So, what are common mistakes in home solar installation? Many buyers focus on the lowest price and overlook shading from nearby trees, chimneys, or water tanks. One shaded panel can reduce the output of an entire string. Some installers also estimate production without studying the roof’s direction, tilt, and seasonal sunlight. That shortcut may look harmless on paper. It is not.

Andy Sendy, a solar industry analyst and consultant, offers a useful warning: “The cheapest solar quote is rarely the best long-term value.” His point reflects a common field experience. A low bid may exclude monitoring equipment, surge protection, proper grounding, or future maintenance. Ask for each item in writing. Check the panel and inverter warranties. Confirm who will repair a loose connector after heavy rain.

Even experienced buyers can miss small details. Cable routes may pass too close to sharp roof edges. Inverters may be installed in hot, poorly ventilated spaces. Battery systems may lack enough clearance for safe inspection. These problems are not always visible during a sales visit.

A reliable installation begins with questions, not pressure. Request production estimates, equipment datasheets, project references, and a clear commissioning plan. Review the proposal carefully. Then ask what could go wrong. That answer may reveal more than the promised savings.
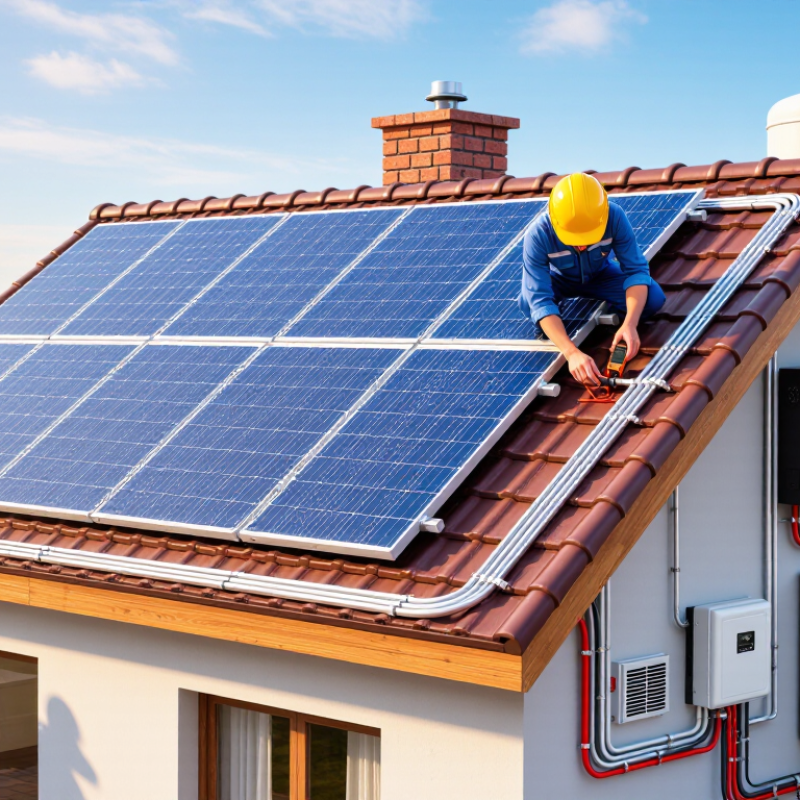
China Best Solar Installation What Mistakes to Avoid?

Assess Site Yield First: China Added 277.17 GW of PV Capacity in 2024

China Best Solar Installation: What Mistakes to Avoid?

China added 277.17 GW of photovoltaic capacity in 2024, showing remarkable market momentum. Yet rapid growth does not guarantee strong output from every project. Site yield must be assessed before equipment is selected or construction begins. A roof may look sunny at noon, but nearby towers, trees, dust, and seasonal shadows can reduce annual generation. Measure the site across different hours and seasons.

Check solar irradiance, roof orientation, tilt, usable area, and structural strength. Local weather records also matter, especially wind, snow, humidity, and high temperatures. A small shading line across one module can affect an entire string. Grid capacity deserves equal attention. A suitable site may still face export limits or expensive connection upgrades. Confirm these details with qualified engineers and local grid authorities.

Do not trust a quick desktop estimate. It is often too optimistic. Use on-site measurements, reliable weather data, and conservative loss assumptions. Include cable losses, inverter downtime, module soiling, and future maintenance access. I have seen planning improve after one simple revision: removing crowded panels from a shaded roof edge. That reduced installed capacity, but improved expected yield per panel. More panels are not always better. A clear yield model helps investors compare cost, energy production, and long-term reliability before committing funds.

Size the System Correctly: Account for Typical 0.5% Annual PV Degradation

China Best Solar Installation: What Mistakes to Avoid?

Correct system sizing starts with realistic energy expectations. A new photovoltaic system does not produce the same output forever. A typical annual degradation rate is about 0.5%, so a panel may retain roughly 88% of its original capacity after 25 years. The decline is gradual, but it matters.

A 10 kW system could lose around 1.2 kW of effective capacity over that period. If the design only matches today’s electricity use, future production may fall short. Check twelve months of utility bills, seasonal demand, roof orientation, shading, and local sunlight conditions. Include future loads, such as an electric vehicle or heat pump. Small details matter.

Do not size from the roof area alone. Ask for a year-by-year production estimate, not only a first-year figure. The calculation should include temperature losses, dust, wiring, inverter efficiency, and degradation. A conservative estimate is more useful than an impressive promise. On site, even a nearby tree can change afternoon output. Yet projections may still look too optimistic. Review the assumptions carefully, and leave a modest production margin. Annual monitoring can reveal unexpected losses early, although the data will not explain every problem by itself.

China Best Solar Installation: What Mistakes to Avoid? — Size the System Correctly: Account for Typical 0.5% Annual PV Degradation

Project Planning Dimension Planning Assumption Year 1 Year 10 Year 25 Installation Implication
Annual PV degradation rate 0.5% per year 0.0% loss Approximately 4.4% loss Approximately 11.3% loss Include long-term output decline when calculating system size.
Remaining relative power Formula: 100% × (0.995)n−1 100.0% 95.6% 88.7% A system that exactly meets the load in year 1 may undersupply the load later.
Reference system capacity 10.0 kWp 10.0 kWp equivalent 9.56 kWp equivalent 8.87 kWp equivalent Use the design-life output requirement rather than only the initial nameplate rating.
Illustrative annual energy yield 1,200 kWh per kWp in year 1 12,000 kWh 11,470 kWh 10,640 kWh Confirm the local solar resource, shading, azimuth, tilt, temperature, and system losses before final sizing.
Required initial capacity for a year-25 target Target equals 10.0 kWp at year 25 11.3 kWp recommended 11.3 kWp recommended 10.0 kWp equivalent output Approximate sizing factor: 1 ÷ 0.8867 = 1.128, before other design margins.
Estimated additional capacity Compared with a 10.0 kWp base design Approximately +1.3 kWp Approximately +1.3 kWp Offsets approximately 1.13 kWp of degradation Check roof area, structural loading, inverter limits, local regulations, and export constraints.
Key mistake to avoid Sizing only for first-year production Initial output may appear sufficient Output has declined gradually Long-term shortfall may reach approximately 11.3% Define the required performance year, then size the array using the degradation-adjusted output.
Calculation note: The table uses the compound degradation model Remaining output = Initial output × (1 − 0.005)n−1. The 1,200 kWh/kWp annual yield is an illustrative planning value, not a universal value for every location. Final sizing should use a site-specific solar assessment and include inverter, wiring, temperature, shading, soiling, availability, and battery losses where applicable.

Verify Components Against IEC 61215 and IEC 61730 Safety Standards

China Best Solar Installation: What Mistakes to Avoid?

Verify Components Against IEC 61215 and IEC 61730 Safety Standards

Rapid growth makes component verification essential. The IEA PVPS Trends 2024 report recorded about 456 GW of new solar capacity worldwide in 2023. More installations also mean more opportunities for weak documentation and mismatched components. IEC 61215 evaluates module design reliability through tests such as thermal cycling, humidity-freeze, and mechanical load. IEC 61730 focuses on electrical and fire-related safety. These standards are related, but they are not interchangeable.

During project inspections, check the exact module model, factory, and bill of materials against the certificate. A certificate for one glass thickness or encapsulant should not automatically cover another version. Request complete test reports from an independent, accredited laboratory. Confirm the report number, standard edition, sample configuration, and validity. Do not rely on a logo printed on a quotation. That shortcut can create expensive surprises.

Tips: Compare the junction box, cables, connectors, glass, and frame with the certified design. Ask whether any production change triggered retesting. NREL’s field-performance review found a median module degradation rate near 0.5% per year, but individual projects varied widely. That figure is useful, not universal. I would also record serial numbers during delivery, because paperwork can look correct while the shipment differs. One missed detail matters.

Prevent Shading and Wiring Losses: Target a 75–85% Performance Ratio

A strong solar installation should target a 75–85% performance ratio. Shading is often the hidden problem. A vent pipe, nearby tree, or parapet can shade only a few modules, yet reduce the whole string’s output. Site surveys should check shadows in winter, summer, and late afternoon. Digital models help, but a physical inspection remains valuable.

Tips: Keep modules away from roof edges and future tree growth. Use string layouts that limit shaded modules. Check cable routes before mounting begins. DC cables should be short, protected, and properly sized. Loose connectors and oversized cable loops create resistance, heat, and avoidable wiring losses. Label every circuit clearly. Small details matter.

During commissioning, compare measured voltage and current with design values. Thermal checks can reveal warm connectors that visual inspection misses. Clean cable management also helps maintenance teams find faults quickly. In my experience, installers sometimes focus on panel placement and forget the inverter area. That mistake is easy to repeat. A 75–85% performance ratio is not guaranteed by quality modules alone. It depends on shading control, accurate design, careful wiring, and honest performance testing. Recheck assumptions after installation, especially when the roof has changed or new obstructions appear.

Commission and Monitor Properly: Compare Output Against Modeled Energy Yield

China Best Solar Installation: What Mistakes to Avoid?

Proper commissioning begins when the panels are already producing power. Confirm cable labels, protection settings, inverter status, and meter readings on site. Record the test date, weather, irradiance, module temperature, and system availability. A screenshot alone is weak evidence. Export the raw data whenever possible. Small wiring errors can remain hidden until the first high-load afternoon.

Compare actual output with the modeled energy yield, not with a single daily target. The model should state its assumptions, including orientation, shading, temperature losses, soiling, and expected availability. Check hourly production against irradiance measurements and the monitoring platform. A cloudy day may look disappointing but still match the model. A clear day with low output needs investigation. Possible causes include shading, clipping, sensor errors, dirty surfaces, or incorrect capacity settings. The model may be wrong. Recheck it.

Tips: Keep a commissioning log with photographs and meter readings. Review performance for at least several weeks. Use a weather station or reliable irradiance data near the site. Compare the same time periods, not random dates. Set alerts for abnormal drops, but do not trust alerts blindly. Inspect the physical equipment. Monitoring cannot detect every loose connection. A careful technician should question unusual results, document corrective work, and update the model when site conditions differ. Even experienced teams miss details. That is why independent verification matters.

FAQS

Why should a solar system include annual panel degradation?

Solar panels gradually lose output, typically about 0.5% each year. After 25 years, a panel may retain roughly 88% of its original capacity. A 10 kW system could lose about 1.2 kW of effective capacity. That decline is slow, but noticeable.

How should the system size be calculated?

Review twelve months of electricity bills, not one recent bill. Include seasonal demand, roof direction, shading, and local sunlight. Allow for future loads, such as an electric vehicle or heat pump. Roof area alone is not enough.

What production estimate should an installer provide?

Request a year-by-year production estimate. It should include temperature, dust, wiring, inverter, and degradation losses. A conservative estimate is more useful than a bright first-year promise. No estimate is perfect.

How can shading reduce solar output?

A tree, vent pipe, or parapet can shade only a few modules. However, one shaded module may reduce the output of an entire string. Inspect shadows during winter, summer, and late afternoon. Digital models help. Physical checks still matter.

What performance ratio should a well-designed system target?

A practical target is usually a 75–85% performance ratio. Quality panels alone cannot guarantee this result. Shading control, wiring, design accuracy, and testing all affect performance. Targets are not promises.

Which component documents should be checked before installation?

Match the exact module model, factory, and bill of materials with the certificate. Check the junction box, cables, connectors, glass, and frame. Confirm the report number, standard edition, sample configuration, and validity. A printed logo proves little.

Why do safety standards need careful verification?

One standard evaluates module reliability through tests such as thermal cycling and mechanical loading. Another focuses more on electrical and fire-related safety. They are related, but not interchangeable. Use complete reports from an independent, accredited laboratory.

How can wiring losses and installation faults be found?

Keep DC cables short, protected, and correctly sized. Avoid loose connectors and oversized cable loops. Label every circuit clearly. During commissioning, compare measured voltage and current with design values. Thermal checks may reveal hot connectors that inspection misses.

Is annual monitoring enough to explain every performance problem?

Monitoring can reveal unexpected losses early. It may show declining output, but not always identify the exact cause. Check shading, connectors, cable routes, and inverter conditions onsite. I would not trust a neat spreadsheet alone.

Conclusion

A successful home solar installation begins with careful planning rather than simply selecting equipment. One of the first questions homeowners should ask is, “what are common mistakes in home solar installation?” Typical errors include skipping a detailed site-yield assessment, misjudging household energy needs, and installing too much or too little capacity. In 2024, China added 277.17 GW of photovoltaic capacity, showing the importance of accurate design as solar deployment expands. System sizing should also allow for approximately 0.5% annual panel degradation so future output remains sufficient.

Safety and efficiency depend on more than panel placement. All major components should be checked against IEC 61215 and IEC 61730 requirements, while shading, cable routing, connector quality, and wiring distances should be reviewed to reduce energy losses. A well-designed system should aim for a 75–85% performance ratio under normal conditions. Finally, professional commissioning and ongoing monitoring are essential. Comparing actual production with the modeled energy yield can reveal faults, underperformance, or maintenance needs before they become costly problems.

Aria

Aria

Aria is a dedicated marketing professional with a deep passion for innovative strategies and a keen understanding of our company's product offerings. With a wealth of experience in the industry, Aria excels at crafting engaging content that highlights the unique features and benefits of our......